AI volume usage overview
Here you can find statistics on your previous AI consumption and can thus infer your future needs.
Volume overview
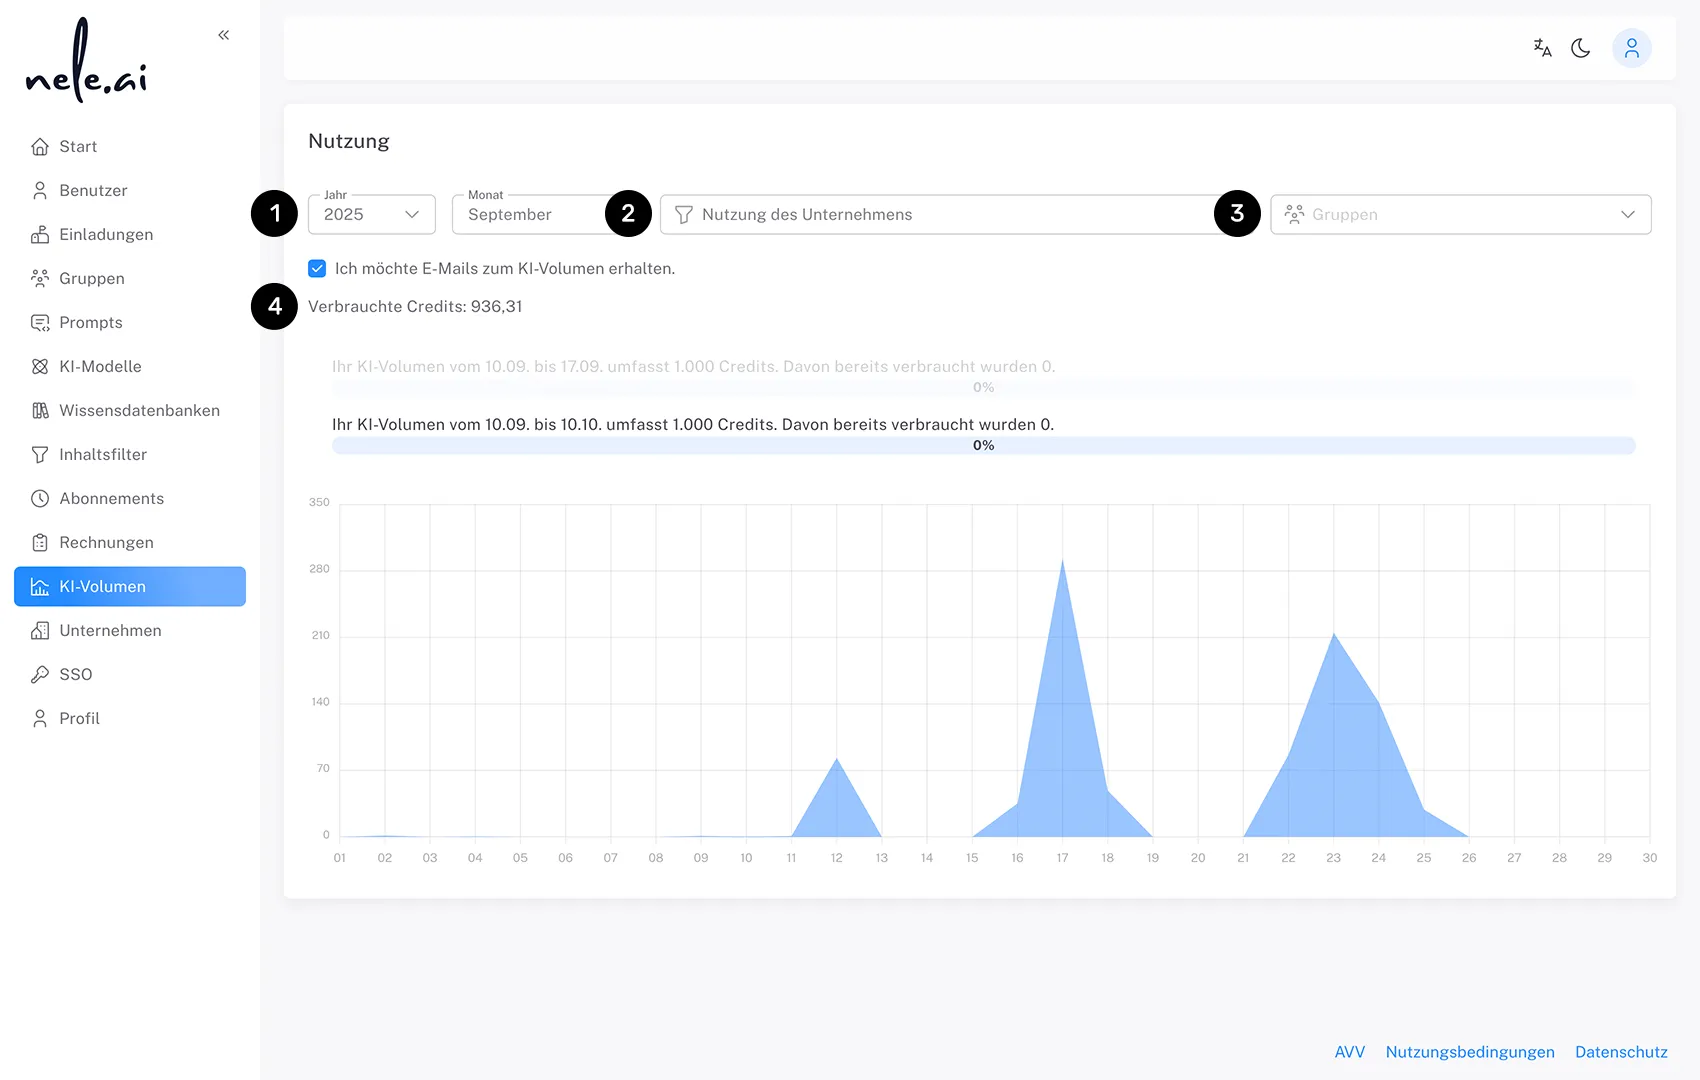
This overview shows you the total number of credits used this month. An area chart visualizes daily credit consumption for a better overview of usage peaks.
To access the view for a specific period of time, click on the date picker (1) and set the desired year and month. You will then be shown the statistics for your selected month.
To switch between statistics for different views — such as your personal usage and your company usage — click on the “Company” selection box (2).
When displaying company usage, you also have a group filter (3) available. You can use this to specifically select one or more published groups to view their consumption. When several groups are selected, the consumption values are automatically added up and presented as a total sum.
The total amount of credits used for the current view is shown prominently above the chart (4). This sum is automatically adjusted to the selected filters and time periods.